Overview
Pipelines, Tasks, Transformations & Data
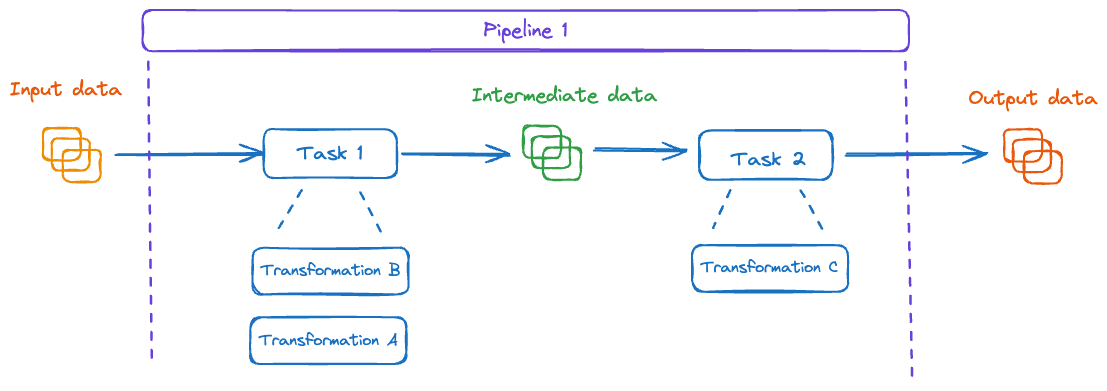
- Pipeline: Is a set of Tasks. Executed by an orchestrator (e.g Apache Airflow/Oozie etc.)
- Task: An actual computation job that is being executed. for example A spark Job or a DBT project. A Task is comprised from a set of Transformations (TFs)
- Transformation: A single logical action such as an SQL query, a Spark Action or a DBT Model.
RF
Definity agents are running as part of the Tasks execution and can observe all transformations and their Input/Output datasets. This is how Definity builds the task-dataset lineage and can also obtain column level lineage.
Point-In-Time (PIT) & Run Time
- Run Time Pipeline are executed every defined time period (for example every day @ 12:00) each specific start time is the Pipeline/Task/.
- Point In Time (PIT) Each such execution also has a logical time indicating the input data consumed. This is the PIT or logical date. A user can run the logical date 01/01/2020-22:00 with Run Time of 08/01/2024-14:00 and then again with Run Time of 09/01/2024-17:00
Metrics
Metrics are the basic building blocks of the monitoring in Definity. A metric is a numeric value that was measured on a specific asset (table/column or pipeline/task/transformation) in a specific execution (Run Time).
For example:
Pipeline: A / Task: B / PIT: 07-25-23 / Run Time: 07-25-26 / Table: T1
Metric type: volume count - Value: 1177500
Metric types
Metrics are split into five main analytical pillars of data observability:
- Time - metrics that measure the time dimension of the pipeline's data and execution. E.g., Freshness, Duration.
- Structure - metrics that measure the data structure consumed and generated by the pipeline. E.g., Schema (size, types, order).
- Distribution - metrics that measure the data values distribution and behavior. E.g., Uniqueness, Null, Value Distribution, Binning.
- Volume - metrics that measure the data volume. E.g., Total Row Count, Read Count, Write Count, Partitions, Files, Bytes.
- Environment - metrics that measure changes in the data pipeline itself, the code, and the environment setup.
Core Pipeline Health Metrics
While Definity tracks hundreds of metrics across all five pillars, five metrics stand out as the fundamental health signals for any pipeline. These are the metrics Definity surfaces at the top level for every pipeline, because together they give a complete at-a-glance picture of pipeline health — spanning both execution and data:
| Metric | Pillar | What it tells you |
|---|---|---|
| SLA | Time | Did the pipeline start on time? |
| Duration | Time | Is the pipeline taking longer than usual to execute? |
| Freshness | Time | Is the input data fresh — or is the pipeline consuming stale data? |
| Volume | Volume | Did the pipeline read and produce the expected amount of data? |
| Distribution | Distribution | Are the data values behaving as expected — no unexpected nulls, shifts, or anomalies? |
SLA and Duration reflect execution health — whether the pipeline ran correctly and on time. Freshness, Volume, and Distribution reflect data health — whether the data it produced is correct and timely.
Monitoring all five together gives a unified view of pipeline reliability, without needing to dig into hundreds of individual metrics to know if something is wrong.
Metric profiles
- Metadata metrics - metrics that can be extracted for "free", with no additional query resource overhead. These metrics are calculated by the data platform (e.g., Spark, DBT, DWH).
- Metrics requiring additional compute - metrics that require additional query resource overhead, ranging from a single pass on the data to more advanced analysis requiring data shuffles or multiple scans.
Tests
A test is defined as the valid range of values for a specific metric.
If in a new execution of the pipeline the metric will have a value outside this range, the test will fail and an alert will be generated.
definity Test Engine begins to generate automated tests for a specific metric (for a specific pipeline) after a baseline for the metric was established.
- I.e., tests are only created after min ~4-5 pipeline executions are completed successfully with the specific metric.
- If a new metric is opted-in, ~4-5 successful pipeline executions are also required (to establish a baseline), before tests will be generated for it.
Test action definition:
| Name | Action | Comments |
|---|---|---|
| Alert | Raise an alert | Currently alerts are internal in Definity. Email/Slack integration will be added |
| Pass | Ignore test failure | Used for temporary muting tests |
| Break | Stop pipeline execution | Currently not supported |